
Author: Vinay Jain, Niraj Singh & Sekhar MK, Data Science and AI department, Rakuten India
Let’s start with an example on the importance of Data Quality —
You booked flights for your family vacation. You get the chance to finally use your miles from the rewards program and “free booking” it is!
To your surprise, you get charged hundreds of dollars.
What went wrong?
The airlines accidentally charged customer accounts in dollars instead of airline miles.
The “bad data” or poor quality of data not only impacts companies financially but also in terms of productivity, reputational damage and missed opportunities.
According to Gartner research, the economic and financial impact of poor data quality on an organization is $9.7 million per year. Forrester reports that around one-third of analysts spend more than 40 per cent of their time screening and validating their analytics data before it can be used for strategic decision-making.
As data is becoming the core of business decision making, teams are constantly monitoring the known KPIs (metrics, logs, traces). But given the complexities, data quality issues cannot be addressed with conventional monitoring. This is where Data Observability comes into the picture. Observability provides us with a complete 360-degree view that includes monitoring, tracking, and prioritizing incidents to avert data downtime.
What is Data Observability?
In the simplest of words, data observability helps teams keep a tab on the health of the data in their systems and eliminate data downtime. The more observable the data, the easier it will be to track down an issue.
Data can break at any point in the pipeline, such as during data processing, data transformation, during integration, broken APIs, during migration, schema changes, manual entries etc., leading to loss of revenue, wasted resources and unhappy customers. This is where data observability comes into play. Here are the key features of data observability:
Freshness
Freshness refers to “How up-to-date” your data is. It is the measurement of data recency in the data tables. You need to ensure that your data is not stale to avoid wastage of time and money.
Distribution
Data distribution tells you whether your data is within the accepted range or not.
Volume
Volume refers to the amount of data in a file or completeness of the data tables. If there are sudden changes in row numbers, you should be aware of that.
Schema
Monitoring any changes made in the schema is crucial. Schema changes are often the culprits of data downtime incidents. So, schema audit is imperative to understand the health of your data ecosystem.
Lineage
Data Lineage is the life cycle of the data. It illustrates the end-to-end data flow from origin to destination. It helps in tracking both upstream and downstream data to ensure data is precise and reliable.
AI and Data Observability – Future of Data
With organizations using Machine Learning models for major business operations and decisions, more and more data is getting utilized. As a result, it has now become imperative for ML engineering teams to not just monitor data but also to understand the health of their data.
To make this data more reliable, a trustable observability system is necessary as it can prevent severe and inadvertent consequences that monitoring alone can’t catch or prevent.
Models can break at any point in the production pipeline due to data quality issues – right from data ingestion to the model output. These can go undetected during testing and validation.
The impact of data quality on ML models goes beyond revenue all for business and can lead to serious consequences for real-world applications.
Example of Bias Issues: In 2020, a man in Detroit was wrongfully arrested and jailed after being misidentified by facial recognition software, likely due to bias issues that include training datasets that are predominately white and male.
Example of Flawed Labels: MIT removed their complete 80 Million images dataset due to racist, sexist, and offensive labels and the ImageNet library also removed over 600,000 images after the online art project ImageNet Roulette disclosed similar glitches. These datasets have been used to train ML models for many years.
Problems caused due to Data Quality issues in ML
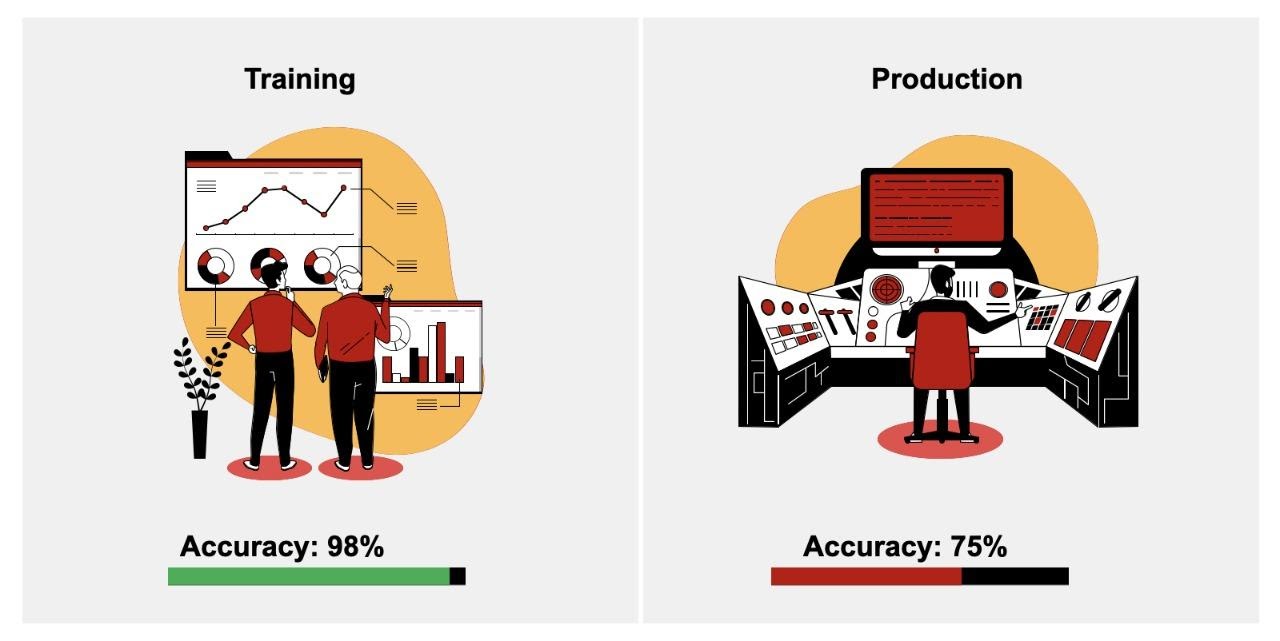
Training-Serving Skew:
The difference in ML model behaviour in training vs when handoff to production is commonly referred to as training-serving skew.
One of the possible reasons is that the data your model was trained on is statistically different from the data encountered in production.
This can also occur due to another common inconsistency in transformation scripts used between the two environments. Many times, the confusion of which is the final code to be used for feature transformation is caused due to missing version control practices.
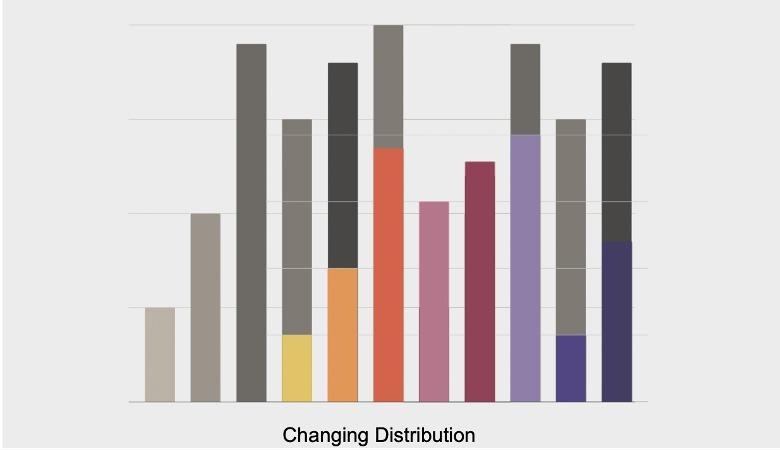
Data Drifts:
Another common issue noticed is that the distribution of data used by the model changes over time. It is also known as data drift or feature drift.
Data drifts can happen over time or can also happen suddenly, which causes degradation in model performance.
Data Issues due to the source:
An ML engineer must also be aware of the reliability of the data sources. Data cannot be expected to be of high quality, with low noise and correctly labelled as we used in staging. Many times, you will end up dealing with data that has no guarantee of quality or freshness in production, especially if we rely on external sources of data or third-party data.
Observability at every stage of Model Development Lifecycle
Data Observability helps data scientists and ML engineers to shift from being reactive towards model performance issues to become proactive.
Key pillars for any observability system:
Detection
This specifically refers to the timely detection of issues with models in production by monitoring key performance metrics. Not knowing about the problem can lead to wrong targeting or irrelevant personalization for customers, which can go on for weeks to months. Therefore, reducing time to detection is a sign of a good observability solution. While you are building your model, it can help in finding issues with data or models to build much closer to production scenarios.
Resolution
Observability framework not just helps you with finding the issues but also helps you in finding the root cause, which can lead to reducing time to resolve the problem. Example Data Observability features that can help in finding the root cause is data distribution which can help in identifying data drifts over time.
Alerting
An intelligent alerting module to alert you with not just the details of the issue but also recommend a way to augment your training sets and notify you to retrain your model. These alerts could be configured to be sent on multiple channels and to various stakeholders.
Validation & Training Stage
During the training and validation stage, the data observability framework can help in avoiding the training-production skew problems, which can be detected by the framework by learning differences in input data from the production data.
With the various versions of the model, data scientists can be assisted during the deployment stage by the data observability framework to identify which is the best-suited model to be deployed in production. This evaluation is done by an observability framework using various metrics collected against each version considering model inputs and output.
Production Stage
After deploying the model in production, all input and output data is monitored and validated with ground truth by a good data observability framework. This helps in knowing whether the prediction is relevant for the end-users or not.
However, in other cases where ground truth is missing or is not available immediately, data observability helps by tracking metrics such as model performance to notify users in case of any issues or shift from expected values.
Modern Data Systems Architecture
Exploding data supply and demand are pushing modern data pipelines to the breaking point. Enterprise data consumers (Data engineers, data scientists and analysts) want to use more and more data from a wider variety of sources, often on a real-time basis, to improve decision-making and optimize operations.
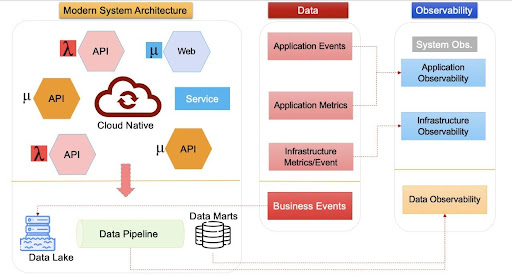
The modern data architecture includes systems and functions to collect data using ETL/ELT functions, APIs, and event streams which is then sent to a data lake from where it is used by transforming in business or machine-usable format via thousands of data pipelines.
These systems generate data such as application events and metrics, which can be monitored via system monitoring and infrastructure monitoring frameworks. While data from pipelines are used for advanced analytics or by machine learning models, which generate business critical events and now can be observed via data observability systems.
Conclusion
Data observability can help data consumers at every step of data utilization. While for data scientists and engineering teams, it helps in the whole process of validating, monitoring, troubleshooting, and improving the ML models; for data analysts and business owners, it can help in gaining confidence to make decisions using data. Data observability can identify gaps by analyzing data over time, both at the input and at model output predictions. It can provide proactive and resourceful notifications by identifying issues in production which can help in faster resolution. Get started today by implementing a holistic data observability system and realize the true value of data by enabling trust in the data value chain.